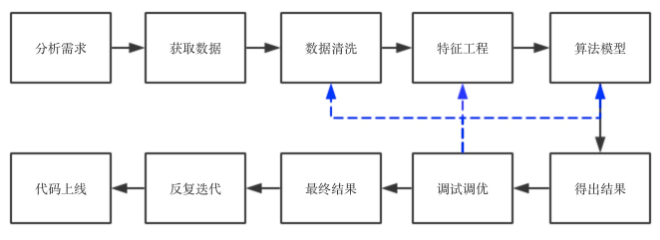
According to my project experience, when I came to the project, I first analyzed the purpose and requirements of the project, and understood what the problem was and what effect it wanted to achieve. Then extract the data and do basic data cleaning. The third step is feature engineering. This is a dirty job and requires a lot of energy. If the feature engineering is done well, then the following algorithm is actually not very different. On the contrary, no matter what algorithm is selected, the effect will not be There are breakthrough improvements. The fourth step is to run the algorithm. Normally, I will run all the algorithms that can be run first to see the effect, analyze the precesion/recall and f1-score, and see if there are any abnormalities (for example, there are several algorithms) The precision is very good, but the recall is very low. It is necessary to find the reason from the data, or whether it is because the algorithm is not suitable for the data from the algorithm). If there is no abnormality, then proceed to the next step and choose one or two results. The best algorithm for tuning. There are many tuning methods. To adjust the parameters, you can use grid search, random search, etc., to adjust the performance, you can perform specific analysis based on specific data and scenarios. After tuning, run the algorithm to see if the result has improved. If not, find the reason, the data or the algorithm? Is the data quality poor, or is it a feature problem or an algorithm problem. Check one by one and find a solution.
For feature problems, return to the third step and then perform feature engineering. For data quality problems, return to the first step to see if there are any omissions in data cleaning and whether outliers affect the results of the algorithm. For algorithm problems, return to the fourth step and see the algorithm flow. Which step went wrong. If it does not work, you can search related papers to see if there are any solutions in the papers. Repeat this a few times, you can get the results, write technical documents and analysis reports, and then explain what we do to business personnel or products, and then they make suggestions/needs, continue to loop, and finally the code is online, and bugs are corrected. Until the end of the project.
Intuitively, it can be represented by a flowchart:
Today we talk about data cleaning. Why do we need to perform data cleaning? The data we see in the book, such as the common iris data set, housing price data, movie rating data set, etc., are of high quality, with no missing values, no abnormalities, and no noise. In the real data, The data we get may contain a lot of missing values, may contain a lot of noise, or there may be abnormal points due to manual input errors, which cause some trouble for us to dig out effective information, so we need to adopt some methods , Try to improve the quality of the data. Data cleaning generally includes the following steps:
1. Analyze the data
2. Missing value processing
3. Outlier handling
Four. De-duplication
5. Noise data processing
6. Some useful data processing gadgets
1. Analyze the data
In actual projects, when we determine the requirements, we will find the corresponding data. After we get the data, we must first perform descriptive statistical analysis on the data to check which data is unreasonable, and we can also know the basic situation of the data. If it is sales data, you can understand the basic situation of the data by analyzing the total sales of different commodities, per capita consumption, per capita consumption times, etc., the consumption of the same product at different times, consumption frequency, and so on. In addition, you can understand the quality of the data, whether there are abnormal points, whether there is noise, etc. through graphing. For example (there is less data, just use R to plot):
#A group of managers whose annual salary is more than 100,000 yuan pay=c(11,19,14,22,14,28,13,81,12,43,11,16,31,16,23.42,22,26,17 , 22, 13, 27, 180, 16, 43, 82, 14, 11, 51, 76, 28, 66, 29, 14, 14, 65, 37, 16, 37, 35, 39, 27, 14, 17, 13 ,38,28,40,85,32,25,26,16,12,54,40,18,27,16,14,33,29,77,50,19,34) par(mfrow=c(2 ,2))#Change the drawing window to 2*2, which can display four pictures at the same time hist(pay)#Draw histogram dotchart(pay)#Draw a dot chart barplot(pay,horizontal=T)#Draw a box chart qqnorm( pay);qqline(pay)#Draw QQ diagram
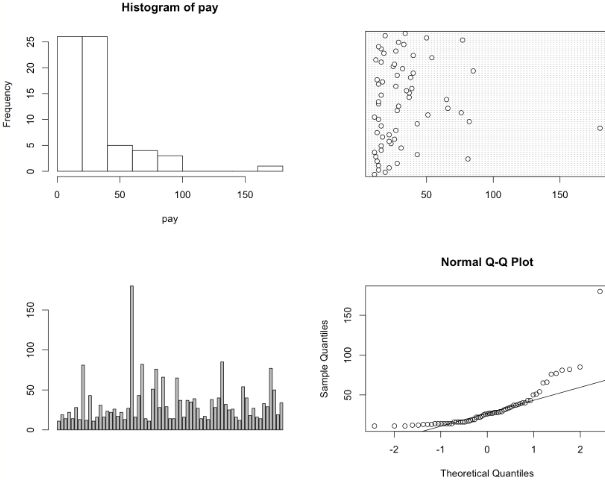
It can be clearly seen from the above four pictures that 180 is an abnormal value, that is, the 23rd data needs to be cleaned up.
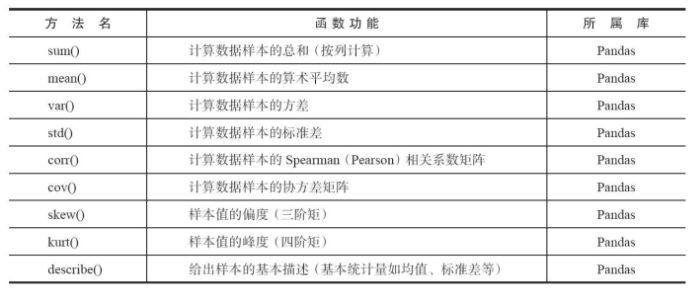
Python also contains a large number of statistical commands, among which the main statistical feature functions are shown in the following figure:
2. Missing value processing
Missing values ​​are an inevitable problem in actual data. Some people delete missing data when they see it, and some people directly assign a value of 0 or a special value. So what should I do? Different strategies should be adopted for different data scenarios. First, the distribution of missing values ​​should be judged:
1 import scipy as sp 2 data = sp.genfromtxt("web_traffic.tsv",delimiter = "")
The data is as follows:
>>>data array([[ 1.00000000e+00, 2.27200000e+03], [2.00000000e+00, nan], [3.00000000e+00, 1.38600000e+03], ..., [7.41000000e+02, 5.39200000e+03], [7.42000000e+02, 5.90600000e+03], [7.43000000e+02, 4.88100000e+03]]) >>> print data[:10] [[ 1.00000000e+00 2.27200000e+03 ] [2.00000000e+00 nan] [3.00000000e+00 1.38600000e+03] [4.00000000e+00 1.36500000e+03] [5.00000000e+00 1.48800000e+03] [6.00000000e+00 1.33700000e+03] [7.00000000 e+00 1.88300000e+03] [8.00000000e+00 2.28300000e+03] [9.00000000e+00 1.33500000e+03] [1.00000000e+01 1.02500000e+03]] >>> data.shape (743, 2)
As you can see, there are missing values ​​in the second column. Now let's look at the number of missing values:
1 >>> x = data[:,0] 2 >>> y = data[:,1] 3 >>> sp.sum(sp.isnan(y)) 4 8
Only 8 of the 743 data are missing, so deleting them has little effect on the overall data situation. Of course, this is when there are few missing values, when there are more missing values, and the information of this dimension is still important (because if the missing values ​​account for more than 95%, you can directly remove the data of this dimension), directly Deletion will have a bad impact on the results of the subsequent algorithm. There are several methods we commonly use:
1. Direct deletion ---- suitable for situations where the number of missing values ​​is small and appears randomly, and deleting them has little effect on the overall data.
2. Use a global constant to fill --- For example, fill the missing value with "Unknown", but the effect is not necessarily good, because the algorithm may recognize it as a new category, which is rarely used.
3. Use the mean or median instead of ---- Advantages: No reduction in sample information, simple processing. Disadvantages: Bias occurs when the missing data is not random data. For normally distributed data, the mean can be used instead. If the data is skewed, the median may be better.
4. Interpolation method
1) Random imputation method-randomly select a sample from the population to replace the missing sample
2) Multiple imputation method-predict missing data through the relationship between variables, use Monte Carlo method to generate multiple complete data sets, analyze these data sets, and finally summarize the analysis results
3) Hot platform imputation-refers to finding a sample (matching sample) similar to the sample where the missing value is located in the non-missing data set, and using the observed value to impute the missing value.
Advantages: simple and easy to implement, high quasi-delivery rate
Disadvantages: When the number of variables is large, it is usually difficult to find a sample that is exactly the same as the sample to be imputed. But we can stratify the data according to certain variables, and use mean imputation for missing values ​​in the layers
4) Lagrangian difference method and Newton interpolation method (simple and efficient, the content in the numerical analysis, the mathematical formula will be added later = =)
5. Modeling method
It can be determined by regression, inference-based tools using Bayesian formal methods, or decision tree induction. For example, using the attributes of other data in the data set, a decision tree can be constructed to predict the value of the missing value.
The above methods have their own advantages and disadvantages. The specific situation should be based on the actual data distribution, the degree of inclination, the proportion of missing values, and so on. Generally speaking, the modeling method is a more commonly used method. It predicts missing values ​​based on existing values ​​and has a higher accuracy rate.
3. Outlier handling
Outliers are usually also called "outliers". When talking about analyzing data, we gave an example to illustrate how to find outliers. In addition to drawing (drawing is not commonly used, because it is difficult to draw when the amount of data is large, and it is slow), there are many other methods:
1. Simple statistical analysis
After obtaining the data, you can perform a simple descriptive statistical analysis on the data. For example, the maximum and minimum values ​​can be used to determine whether the value of this variable exceeds a reasonable range. For example, the customer’s age is -20 or 200, which is obviously What is unreasonable is an outlier.
You can directly use pandas describe() in python:
>>> import pandas as pd >>> data = pd.read_table("web_traffic.tsv",header = None) >>> data.describe() 0 1 count 743.000000 735.000000 mean 372.000000 1962.165986 std 214.629914 860.720997 min 1.000000 472.000000 25% 186.500000 1391.000000 50% 372.000000 1764.000000 75% 557.500000 2217.500000 max 743.000000 5906.000000
2.3∂Principle
If the data obey a normal distribution, under the 3∂ principle, the outlier value is a value whose deviation from the average value in a set of measured values ​​exceeds 3 times the standard deviation. If the data obeys a normal distribution, the probability of a value outside 3∂ from the average value is P(|xu|> 3∂)
3. Box chart analysis
Box plots provide a standard for identifying outliers: if a value is less than QL01.5IQR or greater than OU-1.5IQR, it is called an outlier. QL is the lower quartile, which means that a quarter of the data in all observations has a smaller value than it; QU is the upper quartile, which means that a quarter of the data in all observations has a smaller value than it Large; IQR is the interquartile range, which is the difference between the upper quartile QU and the lower quartile QL, which contains half of all observations. The method for judging outliers by box plots is based on quartiles and interquartile ranges. The quartiles are robust: 25% of the data can become arbitrarily far away and will not interfere with the quartiles, so abnormal The value cannot influence this standard. Therefore, the box chart is more objective in identifying outliers and has certain advantages in identifying outliers.
4. Based on model checking
First build a data model. Anomalies are objects that cannot fit perfectly with the model; if the model is a collection of clusters, then anomalies are objects that do not significantly belong to any cluster; when using a regression model, anomalies are objects that are relatively far away from the predicted value
Advantages and disadvantages: 1. There is a solid theoretical basis in statistics. These tests may be very effective when there is sufficient data and knowledge of the types of tests used; 2. For multivariate data, there are fewer options available, and for high-dimensional data , These detection possibilities are very poor.
5. Based on distance
It is usually possible to define proximity measures between objects. Anomalous objects are those that are far away from other objects.
Advantages and disadvantages: 1. Simple; 2. Disadvantages: The proximity-based method requires O(m2) time, which is not suitable for large data sets; 3. This method is also sensitive to the choice of parameters; 4. Cannot handle areas with different density The data set, because it uses a global threshold, cannot account for this density change.
6. Based on density
A point is classified as an outlier when its local density is significantly lower than most of its neighbors. Suitable for non-uniformly distributed data.
Advantages and disadvantages: 1. Gives a quantitative measure that the object is an outlier, and it can be handled well even if the data has different areas; 2. Like distance-based methods, these methods must have O(m2) time the complexity. For low-dimensional data, using a specific data structure can achieve O(mlogm); 3. It is difficult to select parameters. Although the algorithm handles this problem by observing different values ​​of k and obtaining the maximum outlier score, it still needs to choose the upper and lower bounds of these values.
7. Based on clustering:
Cluster-based outliers: An object is an outlier based on clustering, if the object does not strongly belong to any cluster. The influence of outliers on the initial clustering: If the outliers are detected by clustering, because the outliers affect the clustering, there is a question: whether the structure is effective. In order to deal with this problem, the following methods can be used: object clustering, removing outliers, and object clustering again (this does not guarantee the optimal result).
Advantages and disadvantages: 1. Clustering techniques based on linear and near linear complexity (k-means) may be highly effective to find outliers; 2. The definition of clusters is usually the complement of outliers, so it is possible to find both clusters and Outliers; 3. The generated outlier sets and their scores may be very dependent on the number of clusters used and the existence of outliers in the data; 4. The quality of the clusters generated by the clustering algorithm is generated by the algorithm The quality of outliers is very important.
Approach:
1. Delete outliers-it is obvious that it is abnormal and the number is small and can be deleted directly
2. No processing---If the algorithm is not sensitive to outliers, you can leave it alone, but if the algorithm is sensitive to outliers, it is best not to use it, such as some algorithms based on distance calculations, including kmeans, knn and the like.
3. Mean value substitution-small loss information, simple and efficient.
4. Treated as missing values-can be handled in the same way as missing values
Four. De-duplication
Take the DataFrame data format as an example:
#Create data, data contains repeated data >>> data = pd.DataFrame({'v1':['a']*5+['b']* 4,'v2':[1,2,2, 2,3,4,4,5,3])) >>> data v1 v2 0 a 1 1 a 2 2 a 2 3 a 2 4 a 3 5 b 4 6 b 4 7 b 5 8 b 3 #DataFrame The duplicated method returns a boolean Series, indicating whether each row is a duplicate row >>> data.duplicated() 0 False 1 False 2 True 3 True 4 False 5 False 6 True 7 False 8 False dtype: bool #drop_duplicates method is used to return one DataFrame with duplicate rows removed >>> data.drop_duplicates() v1 v2 0 a 1 1 a 2 4 a 3 5 b 4 7 b 5 8 b 3 #These two methods will judge all columns by default, you can also specify Duplicate items are judged for some columns. Suppose you have another column of values, and you only want to filter duplicates based on the v1 column: >>> data['v3']=range(9) >>> data v1 v2 v3 0 a 1 0 1 a 2 1 2 a 2 2 3 a 2 3 4 a 3 4 5 b 4 5 6 b 4 6 7 b 5 7 8 b 3 8 >>> data.drop_duplicates(['v1']) v1 v2 v3 0 a 1 0 5 b 4 5 #duplicated And drop_duplicates retains the first value combination by default. Pass in take_last=True to keep the last one: >>> data.drop_duplicates(['v1','v2'],take_last = True) v1 v2 v3 0 a 1 0 3 a 2 3 4 a 3 4 6 b 4 6 7 b 5 7 8 b 3 8
If the data is in list format, there are several ways to delete
list0=['b','c','d','b','c','a','a'] Method 1: Use set() list1=sorted(set(list0),key=list0 .index) # sorted output print( list1) Method 2: Use {}.fromkeys().keys() list2={}.fromkeys(list0).keys() print(list2) Method 3: set()+sort( ) list3=list(set(list0)) list3.sort(key=list0.index) print(list3) Method 4: Iteration list4=[] for i in list0: if not i in list4: list4.append(i) print (list4) Method 5: Compare the data of two adjacent elements after sorting, and delete duplicates def sortlist(list0): list0.sort() last=list0[-1] for i in range(len(list0)-2, -1,-1): if list0[i]==last: list0.remove(list0[i]) else: last=list0[i] return list0 print(sortlist(list0))
5. Noise treatment
Noise is the random error or variance of the measured variable. We mentioned anomalies (outliers) above, so are outliers and noise the same thing? We know that the measurement (Measurement) = true data (True Data) + noise (Noise). Outliers belong to observations, which may be caused by real data or noise, but in general they are obviously different from most observations. . Noise includes error values ​​or deviations from expected outlier values, but it cannot be said that noise points include outliers, although most data mining methods treat outliers as noise or anomalies and discard them. However, in some applications (for example: fraud detection), outlier analysis or anomaly mining will be done for outliers. And some points are outliers locally, but they are normal from a global perspective.
I saw an interesting example explaining noise and outliers on Quora:
Outlier: you are enumerating meticulously everything you have. You found 3 dimes, 1 quarter and wow a 100 USD bill you had put there last time you bought some booze and had totally forgot there. The 100 USD bill is an outlier, as it's not commonly expected in a pocket.
Noise: you have just come back from that club and are pretty much wasted. You try to find some money to buy something to sober up, but you have trouble reading the figures correctly on the coins. You found 3 dimes, 1 quarter and wow a 100 USD bill. But in fact, you have mistaken the quarter for a dime: this mistake introduces noise in the data you have access to.
To put it otherwise, data = true signal + noise. Outliers are part of the data.
The translation is:
Outliers: You are exhausting the money in your pocket change purse. You found three dimes, one fifty cents, and a 100 yuan grandpa smiling at you. This 100 yuan is an outlier, because it shouldn’t be in your pocket often..
Noise: You went to Sanlitun to drink at night and got drunk. You need to buy something to stay awake. At this time, you start looking through the coin purse in your pocket. Well, you found three dimes, one fifty cents, and a grandpa worth 100 yuan. Smile at you. But you suddenly feel dizzy and see those three corners as three 1 yuan... Such a wrong judgment makes noise in the data set
So how should we deal with noise? There are several methods:
1. Binning method
The binning method smooths the ordered data values ​​by looking at the "nearest neighbors" (ie, surrounding values) of the data. These ordered values ​​are distributed into some "buckets" or bins. Since the binning method examines the value of neighbors, it performs local smoothing.
Smooth with box mean: each value in the box is replaced by the mean value in the box.
Smooth with box median: each value in the box is replaced by the median in the box.
Smooth with box boundaries: The maximum and minimum values ​​in the box are also regarded as boundaries. Each value in the box is replaced by the nearest boundary value.
Generally speaking, the larger the width, the more obvious the smoothing effect. Boxes can also be of equal width, where the range of each box value is a constant. Binning can also be used as a discretization technique.
2. Regression method
You can use a function to fit the data to smooth the data. Linear regression involves finding the "best" line that fits two attributes (or variables) so that one attribute can predict the other. Multilinear regression is an extension of linear regression, it involves more than two attributes, and the data is fitted to a multidimensional surface. Using regression to find a mathematical equation suitable for the data can help eliminate noise.
6. Some useful data processing gadgets
1. Remove the extra blank lines in the file
Blank lines mainly refer to (,,,, etc.). There is a strip() method in python, which can remove the extra “blanks†at both ends of the string. The blanks here mainly include spaces, tabs ( ), line break. However, after pro-testing, it was found that strip() can match out,, etc., but cannot filter out individual ones. In order to be foolproof, I still like to use troublesome methods, as follows:
#-*- coding :utf-8 -*- #Text formatting processing, filter out blank lines file = open('123.txt') i = 0 while 1: line = file.readline().strip() if not line: break i = i + 1 line1 = line.replace('','') f1 = open('filename.txt','a') f1.write(line1 +'') f1.close() print str(i)
2. How to determine the encoding format of a file
#-*- coding:utf8 -*- #Batch processing encoding format conversion (optimization) import os import chardet path1 ='E://2016txtutf/' def dirlist(path): filelist = os.listdir(path) for filename in filelist: filepath = os.path.join(path, filename) if os.path.isdir(filepath): dirlist(filepath) else: if filepath.endswith('.txt'): f = open(filepath) data = f .read() if chardet.detect(data)['encoding'] !='utf-8': print filepath + "----"+ chardet.detect(data)['encoding'] dirlist(path1)
3. File encoding format conversion, conversion between gbk and utf-8
This is mainly when there are special requirements for the file encoding format, it is necessary to batch convert gbk to utf-8 or convert utf-8 encoded files to gbk encoding format.
#-*- coding:gbk -*- #Batch processing encoding format conversion import codecs import os path1 ='E://dir/' def ReadFile(filePath,encoding="utf-8"): with codecs.open(filePath ,"r",encoding) as f: return f.read() def WriteFile(filePath,u,encoding="gbk"): with codecs.open(filePath,"w",encoding) as f: f.write( u) def UTF8_2_GBK(src,dst): content = ReadFile(src,encoding="utf-8") WriteFile(dst,content,encoding="gbk") def GBK_2_UTF8(src,dst): content = ReadFile(src, encoding="gbk") WriteFile(dst,content,encoding="utf-8") def dirlist(path): filelist = os.listdir(path) for filename in filelist: filepath = os.path.join(path, filename ) if os.path.isdir(filepath): dirlist(filepath) else: if filepath.endswith('.txt'): print filepath #os.rename(filepath, filepath.replace('.txt','.doc' )) try: UTF8_2_GBK(filepath,filepath) except Exception,ex: f = open('error.txt','a') f.write(filepath +'') f.close() dirlist( path1)
It's rather rough just finished writing, and will continue to be revised in the future. The next part is about data conversion, including standardization, normalization and regularization. If there are errors, please correct me!
Laptop Stands And Risers,Laptop Riser Computer Laptop Stand,Laptop Folding Table Stand Aluminum,Laptop Stand Portable Aluminum Laptop Riser
Shenzhen ChengRong Technology Co.,Ltd. , https://www.dglaptopstandsupplier.com